Human Population through the Ages
The Semi-Nomadic Era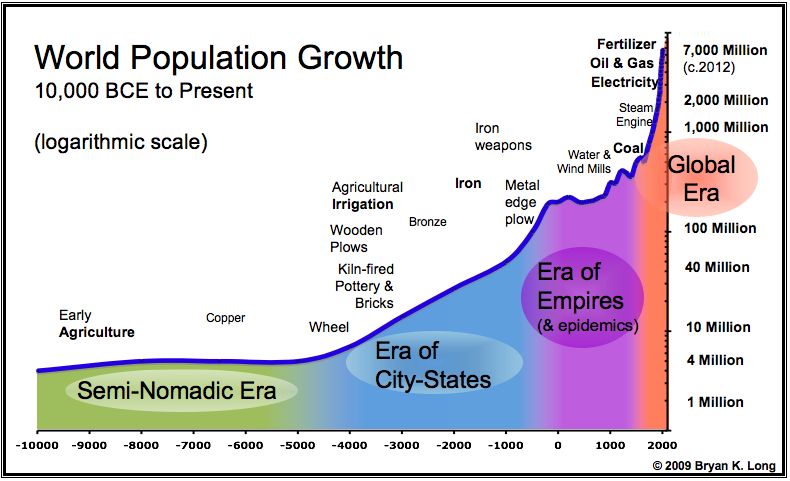
The rate of world population growth during the semi-nomadic era was very low, about 1/100 of 1%. That means for every 10,000 people alive in one year, there would be 10,001 alive the next, on average. Over the 5500 years from 10,000 BCE to 4,500 BCE, the population grew from somewhere around 4 million people to somewhere around 6 million people – we don’t know very precisely because no one was counting back then! By comparison, in 2007 there were more than 8 million people living in New York City alone.
The Era of City-States
Around 4,000 BCE, the rate of global population growth jumped to 7/100ths of 1%. Although that doesn’t sound very high, the power of a compound growth rate shows up in a more than ten-fold increase in population during the period to 500 BCE. By 500 BCE, there were approximately 100 million people on the planet, mostly concentrated in coastal southern Asia and around the Mediterranean Sea. By comparison, the population of Japan in 2009 was more than 125 million.
The Era of Empires
The expansion of political organization from city states to empires brought many economic advantages and opportunities, but it also increased war-related deaths and allowed diseases to spread more quickly. The early part of this period, from 500 BCE to around 1 CE, brought a doubling of the world population. Over the next 500 years, however, world population did not grow at all. Growth recovered around 500 CE, although the period from 500 CE to 1700 CE was marked by spurts of rapid population growth cut back by severe population declines. It was a difficult time, yet overall, the population grew six-fold through the Era of Empires with an average compound annual growth rate of 8/100ths of 1%.
The Global Era
Although the 300 years from 1700 to the present day has be characterized by intense national rivalries and often open warfare, advances in transportation and communications have set all nations within a global context. From around 1700, the world was round not just in scientific theory but in economic practice. Great leaps in industrial activity occurred based on the use of fossil fuels for energy. No longer was the strength of a human limited by our muscles: soon we had machines that could dig, lift, and transform raw materials into the goods and services to sustain life. With this transformation came an enormous increase in population growth. From 1700 to 2000 CE, a period of only 300 years, world population increased 10-fold to over 6,000 Million people – a compound annual growth rate of .75 %, ten times higher than in the previous era. More amazing, from 1900 to 2000, the growth rate was over 1.3 %, doubling twice in just 100 years. World population will have increased by almost as many people in the twelve years from 2000 to 2012 as it did in the 6000 years from the invention of the wheel to the invention of the steam engine!

The key connection regarding population is that with the spread of development (economic development as well as human rights), population growth slows to more sustainable levels. One of the strongest causal links we know is that between declining fertility and population growth, on the one hand, and reduced infant mortality, empowerment of women through women’s rights, broader education and knowledge about family planning and reproductive rights, and higher standards of living, on the other. Population becomes less of a problem as such positive trends create virtuous cycles wherein people make wiser decisions. (They no longer need to have eight children hoping that two will survive). These policy goods are embodied in the U.N. Millennium Development Goals, which serve as both a signpost indicating the better social path as well as a measurement tool to help governments and civil society focus on how we are doing with respect to these key global strategic goals. They are also consonant with the Universal Declaration of Human Rights. Early signs are that the Obama administration will play a dramatically more positive role in advancing these goals and stabilizing population at more sustainable numbers, including by reversing the prior administration’s flawed and ideologically rigid opposition to intelligent family planning and by preserving and extending the vital gains made in primary education for boys and girls in recent years.
Chip, thanks for the excellent comment. Indeed, UN projections are for world population to reach over 9,000 Million by 2050, with essentially all that increase within the less developed regions of the world. Classical economics would have us protect national economic advantages of high technology and education. But doing so would harm us more than benefit us. Instead, developed countries need to do everything they can to assist development.
May I use your chart “World Population Growth” to illustrate my work on Agroforestry as part of my Certificate of Advandes Studies in Sustainable Development? This is not the Certificate, only the control after my fisrt classes, to allow me to write the real Certificate. This work will then be available in the library at the University (in Switzerland) like any other student works, not electronic but only the paper version.
Hi Fabanne, Yes, certainly, you may use it. Please cite Human Population Through the Ages, Econosystemics.com, Copyright Bryan Long, 2009.
Mr. Long,
I am a teacher in NC, and would love to use your Population Chart in my classroom. Can I produce a poster to hang in my classroom of your chart? If not, is there any place this chart can be purchased?
Hi Mr BRYAN LONG,
1% growth during “the semi-nomadic era” was very unbelievable for me. because it means 232 years enough to population growth from 1,000,000 to 10,000,000 !!!!!!!!!!!!!!
1.01^232 x 1,000,000 = 10,059,091
but in the graph it dosnt have any growth for 5,000 years…
1% growth for each year should not be true. may be 1% for each generation (25 years) is more close to real. it needs 5,800 years for growth 10 times more (1,000,000 to 10,000,000)
232 x 25 = 5800
Thank you
Navid Bassiri
dynamic system analysis
Hi Navid, thanks for reading and commenting. You just mis-read, easy to do. The text says “1/100 of 1%,” in other words, an annual multiplier of 1.0001!
Regards,
Bryan
Fascinating! Thanks for the graph! Very useful. I am following the hypothesis that major wars usually followed jumps in population density/ increases in population and in turn were followed by advances in global governance (Roman empire, Greek city states, invention of the state after the 30 years war, Global Governance after WW1 and WW2). Your graph serves to show that this hypothesis could be correct.
Hi Mr Bryan Long, I am contacting you from an educational publishing company.
We would like to use your chart “World Population Growth in a textbook about globalization, development, international cooperation.
Could I have your email for more details?
Thank you in advance,
Valentina
Yes, that can be arranged. You can send an email to [email protected].
I teach introductory geology and like this plot for its simplicity. I’d love to show it side-by-side with the same data plotted in linear scale rather than logarithmic (to emphasize the accelerated growth). Can you please list your sources? Thanks!
Hello again — sending another request for data sources. Thank you!
Hello again — sending another request for data, or at least bibliographic references. Thank you!
Hello Mister Long. I really liked your article. Can I use the figure you have prepared, provided that it is referenced? Would you give me a another references about the Holocene population please? Thank you