World Poverty Econosystemics (Part I)
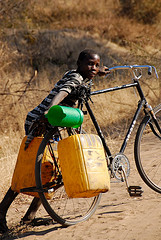 Excerpts from Poverty and Human Rights by Thomas Pogge, 2007:
“The statistics are appalling. Out of a total of 6575 million human beings, 830 million are reportedly chronically undernourished, 1100 billion lack access to safe water and 2600 million lack access to basic sanitation (UNDP 2006: 174, 33). About 2000 million lack access to essential drugs (www.fic.nih.gov/about/summary.html). Some 1000 million have no adequate shelter and 2000 million lacked electricity (UNDP 1998: 49). Some 799 million adults are illiterate (www.uis.unesco.org).
“Roughly 1/3 of all human deaths, some 18 million annually, are due to poverty related causes, easily preventable through better nutrition, safe drinking water, mosquito nets, re-hydration packs, vaccines and other medicines. This sums up to over 300 million deaths in just 17 years since the end of the Cold War–many more than were caused by all the wars, civil wars, and government repression of the entire 20th century. Children under five account for nearly 60% or 10.6 million of the annual death toll from poverty related causes (UNICEF 2005: inside front cover).
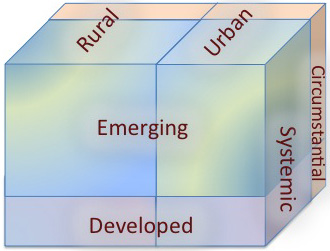
Poverty Differentiation
Insufficient income to acquire those things that the majority in a particular society would consider necessities, such as regular meals, clean water, safe housing, electricity and heat, adequate and clean clothing, basic health care, public education, and basic transportation.
Absolute Poverty:
Systemic Poverty: Poverty which is pervasive with a geographical region over multiple generations, or pervasive within a particular social, ethnic, or religious class within a geographic region. Systemic poverty is reinforced by persistent cultural divisions, exploitation under dominant sociopolitical powers, ongoing environmental degradation, or persistent armed conflict or occupation within a region.
Circumstantial Poverty: Poverty of individuals or families due to misfortunes of health, career, mental disabilities, natural disasters, or other factors outside of a context of systemic poverty.
The greatest number of people living in near absolute poverty, of course, falls into the category of systemic, emerging nation poverty. Of these, around 60% live in rural areas, and on average suffer more absolute poverty than do the urban poor.
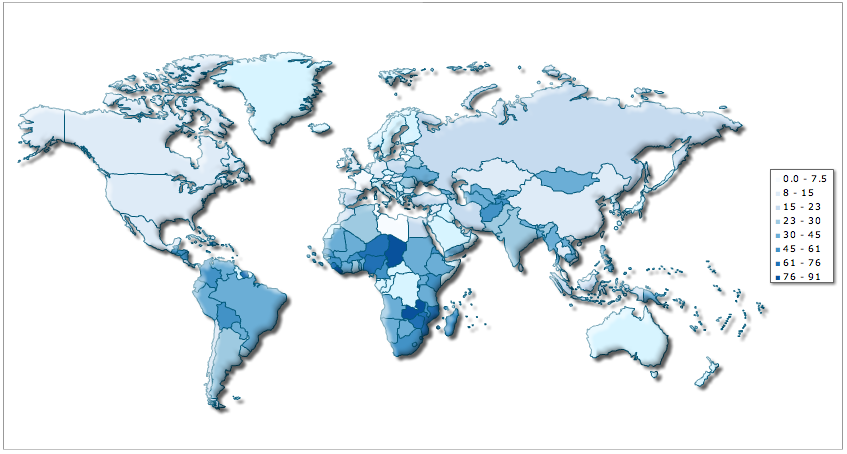
World Poverty Map: Percent of Population Living Below Poverty Line (as defined by each country)
Source: http://www.indexmundi.com/map/?v=69
On the map above, China looks as rich as the United States, and India looks no worse than Argentina, while much of Africa and Latin America look the worst. This is both because in differences in how poverty is defined, and also because the percentage of a nation’s population in poverty is not the same as the percentage of the world’s poor living in that nation.
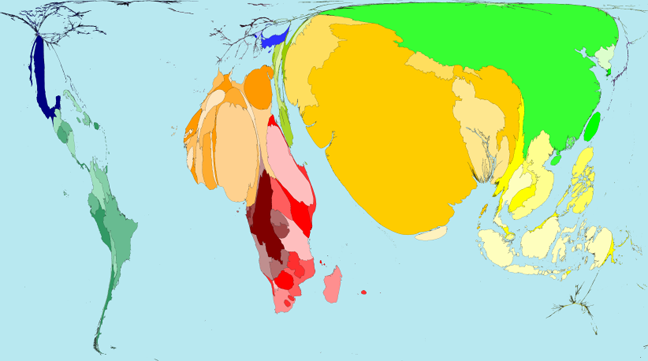
The world looks very different if we look at absolute numbers of people living in absolute poverty (in this case defined as $2 per day or less. This map below, from Worldmapper (http://www.worldpopulationatlas.org/), distorts the size of each nation according to the number of people in that country living on $2 per day or less. While in the previous map above we saw various sub-saharan African nations with the highest percentage of their population in poverty, the map below shows that China and India have the greatest number of people in absolute poverty.
Worldmapper Poverty Map: Country size distorted in proportion to number of people in absolute poverty.
Exponential Wealth:
It is very difficult to accurately assess wealth holding globally, but the chart below shows the result of one careful attempt to estimate the distribution of global wealth. [Data for chart taken from UNU-WIDER World Distribution of Household Wealth, 2008]
But so what? Is concentration of wealth a problem, or a solution? If we replace the dollar signs in the chart above with loaves of bread, then it would obscene to have two people with forty loaves and one hundred people sharing a single loaf. Substituting in mansions and yachts versus hovels and rickshaws would hardly change the perspective. But what of Warren Buffett, who lives in a modest home despite his vast wealth? Most of the world’s wealth is not embodied in currency or consumables, but in productive assets — or more accurately, in organized systems of technology and social institutions that use energy and create valued products and services. These organized systems not only create wealth, they are wealth. The chart above illustrates, in large measure, the degree of ownership over the socio-technical systems of human society — what author Kevin Kelley calls “the Technium.”
The Econosystem Pyramid:
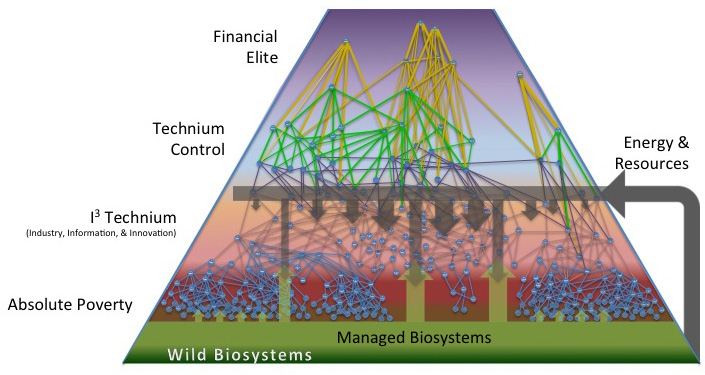
source: Bryan Long, Econosystemics.com
Econosystem: The global system of value production and exchange, including human individuals, human social entities, technologic systems, managed biosystems, and wild biosystems. The econosystem, like all adaptive dynamic systems, develops and utilizes available energy sources in order to make material and organizational transformations.
Each node in the diagram above can be considered a representative individual (or entity) within the econosystem. Prior to the industrial revolution, the econosystem was powered primarily by biomass collected by the human population, using basic technologies (low-technium). With the industrial revolution, beginning around 1775, large flows of energy and resources began to bypass the majority of humans under control of the higher sociopolitical layers. As represented by the dark arrows, fossil fuel and mineral resource flows fed a rapidly developing “high-technium”, implemented by engineers, architects, and managerial talent, and controlled by “capitalists” or political leaders. The lower social majority had to find a way to serve the Technium as “labor”, or continue basic subsistence largely outside the transformational processes of the Technium.
At the present time, approximately ten to twenty times more energy flows into the Technium from fossil or other non-biological sources than flows into it from biological systems. Furthermore, the greater percentage of biological resources also bypasses people at the bottom of the pyramid: large landholders using highly mechanized methods and lots of fossil-fuel-based inputs (illustrated by downward reaching dark arrows) feed bioresources into the middle and upper classes.
In the diagram above, a “highly developed” nation is depicted in the central vertical portion of the pyramid. A disproportionate percentage of energy and material resources flow to the members of the developed nation. The majority of the population lives fully within the Technium (including those “upper layer” individuals enjoying ownership and control of the Technium). For the most part, the Technium is their environment — they make only recreational visits to “enjoy nature”. The “middle class” is well-developed. Relatively few individuals in live in absolute poverty, and those few are mostly circumstantial rather than systemic. Considerable numbers, however, live in relative poverty compared to the majority of citizens in their nation — but their circumstances would generally be seen as fortunate by the absolute poor in underdeveloped nations.
An “emerging” nation is depicted in the left vertical portion of the pyramid. Here large populations live in or near absolute poverty, both in rural areas and in urban slums. At the same time a strong middle class is emerging within a rapidly developing technium, strong interconnections exist with developed nation economies, and members of the financial elite are part of a strongly interconnected global elite.
A “low-development” nation is depicted on the right vertical portion of the pyramid. Here a privileged few enjoy great wealth based upon control of resource extraction, and trade, political systems are generally non-democratic, the middle class is sparse and of low financial strength, and the majority of the population hover near absolute poverty.
It is important to note that the entities in the “control” layer are, more often than not, corporate entities rather than individual humans. In the future, the upper regions of the pyramid may be occupied as well by “technologicaly enhanced” humans and even fully electronic entities! The econosystem emerged from homo sapiens, but it will most likely outlast that species!
…Next: Alleviating Absolute Poverty

Recent Comments